America is a country in the midst of major religious flux.
It is already well-known that a growing number of Americans say they have no religious affiliation. But far less appreciated is this: Only 35% of Americans attend religious services on a weekly basis. And 28% of Americans say they have a different religious identity than the one in which they were raised.
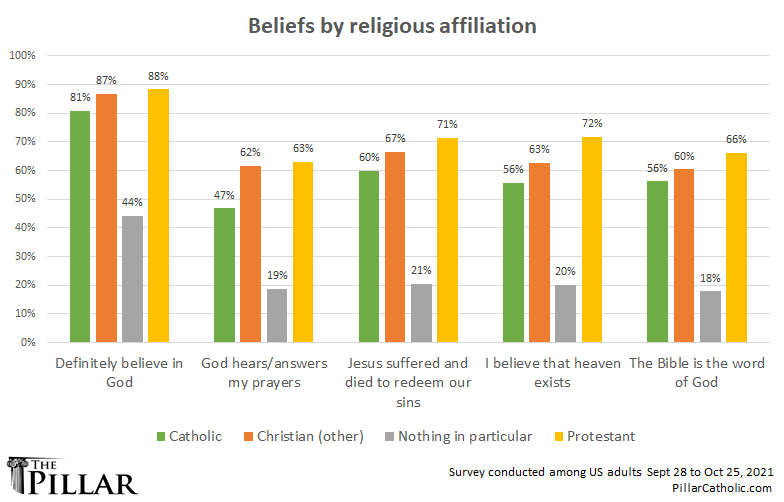
But while American ties to institutional religion weaken, religious belief itself remains common. Fifty-two percent of Americans agree with the statement “Jesus suffered and died to redeem our sins” — including 21% of Americans who say their religion is “nothing in particular.”
These findings are some results from The Pillar Survey on Religious Attitudes and Practices, which we present this week in a series of reports.
Our survey of Catholic and non-Catholic Americans aims to understand what Americans believe, how they think about their religious identity, and how the map is changing for the American religious landscape.
Among Catholics, our survey aims to understand how the pandemic has changed Catholic practice — and if we might “go back” to how things used to be. We also asked Catholics to tell us what matters to them, and how much they trust the Church and her leaders.
Finally, we took a look at why people stop practicing the Catholic faith, and asked what factors might predict whether people raised Catholic will continue going to Mass, and living the Christian life, as adults.
We have some fascinating data to show you this week, beginning with a look at who we Americans are — religiously, that is — and what we believe. Some results will surprise you.
You won’t find work like this anywhere but The Pillar. We make news worth paying for. So become a subscriber — we need you on the team:
If you’re interested in the technical details of our survey work, here they are: The Pillar worked with research firm Centiment to conduct the survey, which was conducted online with 2653 members of Centiment’s nationally representative research panel. This included a nationally representative sample of 1564 Americans and an oversample of 1089 additional respondents who had been raised Catholic, which we used in order to better understand those raised Catholic who still identify as Catholic, and those who now call themselves members of other faiths or of no faith at all.
Based on our sample sizes we are able to draw conclusions about the overall U.S. population and the Catholic population with a margin of error of +/- 3%. With regard to the population of ex-Catholics, our margin of error is +/- 4%.
Religion in America: an overview
Christianity is the most common religious affiliation in the United States, and denominational Protestants have traditionally been the largest blocs of Christians.
But The Pillar’s survey found that the largest group of Christians in America no longer affiliates itself with the term “Protestant.”
Offered the choices of Protestant, Catholic, and “Christian (other),” — in addition to other religious identifiers — 26% of Americans identified themselves as “Christian (other),” while 19% selected “Protestant.”
We asked those in the “Christian (other)” group if they belong to a specific Christian denomination. The most common answer was “non-denominational,” followed by Baptist and Pentecostal.
Catholics make up 24% of Americans, and are by far the largest single community of faith, since the Protestant/“Christian (other)” categories consist of many different denominations.
In total, 70% of respondents are affiliated with some branch of Christianity.
The next largest group is made up of those who are unaffiliated or explicitly have no religion. Twenty percent of Americans described themselves as nothing in particular, atheist, or agnostic.
All other faiths make up the remaining 10% of Americans.
Buy Pillar merch here. Seriously. Buy cool stuff.
The Rise of the ‘Nones’
The increase in the number of Americans who do not identify with any religion in particular, those who are sometimes called the “nones,” has been widely noted.
Fourteen percent of respondents in The Pillar’s national survey listed their religious affiliation as “nothing in particular”.
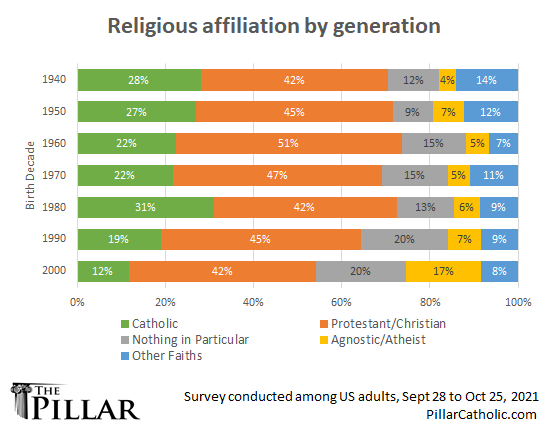
The phenomenon of disaffiliation is on the rise: Among those born during the 1960s through 1980s, an average of 14% describe their religious affiliation as “nothing in particular.” But among those born since 1990 that number rises to 20%
Fifty-nine percent of “nones” say their families of origin had no particular religious affiliation when they were growing up, but the remaining 41% grew up in faith traditions: 15% grew up in families they describe as Christian, 14% grew up as Catholics, and 6% grew up as Protestants.
Americans who identify as religiously unaffiliated are not necessarily unbelievers. Fifty-two percent of them say they have at least some belief in God, and 34% of them say that they pray at least weekly.
Later in this series, The Pillar will dive more deeply into what the data tells us about the “nones.”
In sharp contrast to the “nones” are those who say they are “born again.”
A total of 26% of all Americans say they are born again.
Fifty-four percent of Protestants, and 59% of those who classified themselves as “Christian (other),” describe themselves as “born again or evangelical.”
Protestant and “Christian (other)” Americans born in the 1960s are more likely to describe themselves as born again or evangelical than other generational cohorts.
But with the exception of those born in the 1960s, about one-quarter of Protestants or “Christians (other)” born before 2000 describe themselves as “born again or evangelical.”
Fewer than 20% of adults born after 2000 identify themselves as born again or evangelical.
A Country of Converts
The Pillar’s survey asked respondents: “How would you describe your own current religious affiliation?” and then “When you were growing up, what would you describe as the primary religious affiliation of your family?”
Twenty-eight percent of Americans describe themselves as having a different religious affiliation than did their childhood home.
Compared to the many nations in which a single denomination is the stable majority faith, that kind of constant change is perhaps particularly American.
Every religious affiliation in our survey saw at least 15% of those raised in it leave, and, for every religious affiliation except two, at least 15% of members are converts. The two exceptions are those who describe themselves as “Protestant,” and those who say they are Catholics.
America’s religious fluidity offers helpful context for assessing Catholicism. While 28% of people raised Catholic now claim some other religion, that level of disaffiliation is fairly average: Indeed, 29% of those who describe their upbringing as “Christian (other)” also left that faith.
But while Catholicism has typical American attrition rates, it has below average conversion rates.
In fact, Judaism has more than twice as many converts as Catholicism in America — probably surprising to some readers, since Judaism is often seen as a faith tied to an ethnicity.
In The Pillar’s survey, 32% of respondents were raised Catholic but only 24% still consider themselves members of the Church.
A similar percentage of those raised “Christian (other)” left the faith of their upbringing. But 36% of those who describe themselves as “Christian (other)” grew up in other faiths, including 16% who grew up as Catholics.
Only 7% of those who describe themselves as Catholic grew up in some other faith.
What Americans believe
We asked Americans about their doctrinal beliefs — about God, about Jesus, about heaven and hell, and about the Bible.
A majority of Americans say they definitely believe there is a God, even if sometimes they have doubts, but this percentage is lower among younger generations. Those born since 1970 are more likely to say that they believe in God some of the time, but not at others. And among the very youngest — adults born in or after 2000 — 12% say they don’t really care if there’s a God.
With 74% of Americans identifying as Christian, Muslim, or Jewish, it’s perhaps not surprising that 72% definitely believe in God. But to understand what Americans think about God, we asked some more questions.
Fifty-four percent of Americans agreed that “God loves all human beings.” Forty-six percent agreed that “God hears/answers my prayers.” Unsurprisingly, the rate was much higher among those who identified as Christian, but even 19% of those who described their religious affiliation as “nothing in particular” and 8% of agnostics believed their prayers were heard.
Forty-nine percent agreed that “God is the creator of the universe,” although only 13% interpreted that in terms of what is often termed “young earth creationism”— agreeing with the statement “God created the universe less than a million years ago.”
Just over half of respondents said that “Jesus suffered and died to redeem our sins.” More than a third of Americans agreed that “Jesus physically rose from the dead,” while 31% said that “Jesus is God”.
Statements often associated with a more secular interpretation of Jesus found very low rates of agreement. Eleven percent said that “Jesus sinned sometimes just like everyone else.” Only 7% said that Jesus’ resurrection is metaphorical, while 6% said that Jesus is a fable or myth rather than a historical figure.
Most respondents also had fairly traditional beliefs about the afterlife. Just over half of respondents said they believed heaven exists, while over a third believed in hell. Twenty-nine percent expressed confidence they would see their loved ones in heaven. Twenty percent said they feared they would go to hell — 9% said they “sometimes” feared, this while 11% said they “often” did so,
Ten percent said that “God loves us too much to let anyone go to hell” and 6% thought that people in hell might eventually change and get to heaven.
Fear of hell is religiously wide-spread. Not only do 25% of Catholics, 22% of Protestants, and 25% of those describing themselves as “Christian/other” fear going to hell at least sometimes — so do 25% of Muslims, 14% of Jewish respondents, 8% with no religion in particular, 17% of agnostics and 6% of atheists. Hindus were the only religiously-affiliated group to express no fear of hell.
We also asked a multiple choice question about how people thought about the Bible. The most commonly held belief about the Bible is a traditional Protestant formulation: “The Bible in the unerring word of God which is clear to anyone who reads it.” Overall, 28% of Americans agreed with that statement, including 33% of Catholics, 40% of Protestants, 36% of other Christians, 28% of Muslims, 17% of Jews, and 8% of those with no religious affiliation.
The second-most commonly held view of the Bible expresses a more traditional Catholic formulation: “The Bible is the word of God, but different books are written in different genres and it can be hard to understand.” Twenty-one percent of all Americans agreed with this statement, including 23% of Catholics, 26% of Protestants, 25% of other Christians, 14% of Jews, 24% of Muslims and 10% of those with no religious affiliation.
Smaller percentages of respondents believed that the Bible contains errors or was best thought of as a book of wisdom similar to those of other religious traditions.
Those who considered themselves Catholic, Protestant, or Christian held basic Christian theological beliefs at higher rates than other groups. But those basic Christian beliefs were not universally held by those who identified as Christians of some kind.
And, interestingly, some respondents among the ‘nones’ also expressed fairly traditional Christian beliefs.
Religious Practice in America
While 70% of respondents described themselves as Catholic, Christian, or Protestant, only a minority in each group actually attended religious services on a weekly basis — even before the pandemic.1
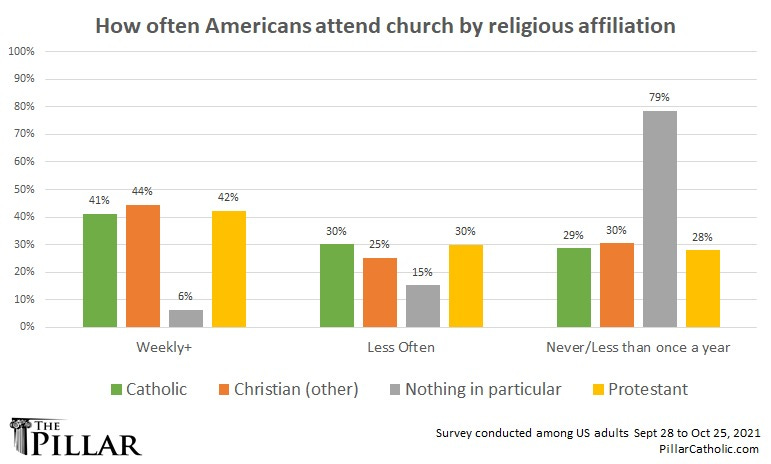
The Pillar’s data suggests a strong correlation between those who devote time to attending religious services, and those who devote time to helping others as well.
Is it possible that the Gospel reading in which Jesus summarizes all commandments into two — “You shall love the Lord your God with all your heart, with all your soul, with all your mind, and with all your strength.” and “You shall love your neighbor as yourself.” — might have practical implications for how people spend their time and their money?
Our data suggests that’s plausible.
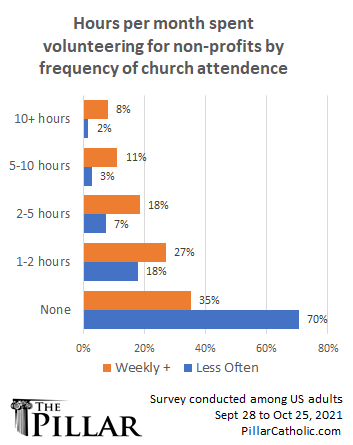
We asked “In a typical month, how many hours do you spend doing volunteer work with non-profits (including places of worship)?”
The responses indicate that those who attend a church or other place or worship at least once a week say they spend significantly more time volunteering than those who do not.
Looking at volunteer data by religious identity also offers interesting insights: Agnostics, atheists, and those with no particular religious affiliation were the least likely to say they spend two or more hours per month volunteering with a non-profit. Christians had moderately high rates of self-reported volunteering, but by far the highest rate was among Muslims, 66% of whom reported spending at least two hours volunteering during a typical month.
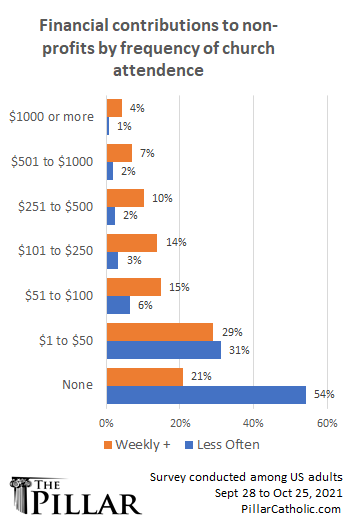
We found similar results when we asked respondents how much money they contributed monthly to non-profits, including places of worship.
Studying the faith
Our study aims to identify the ways in which people understand their own religious identity, practice their religion, and believe its tenets — with a particular focus on Catholicism.
But one trend that defines our work is a downward trend of Catholic sacramental initiation in the first place
Thirty-three percent of American children born in 1965 received Catholic baptisms, while on 15% of children born in 2019 were baptized Catholics.
In the next installment of our survey analysis, The Pillar will examine the trends surrounding the 24% of Americans who describe themselves as Catholic, and the 10% of Americans who were raised Catholic, but no longer consider themselves members of the Church.
Hey — thanks for reading. Remember, work like this doesn’t come cheap. So if you think it matters, become a paying subscriber today:
And, please, tell your friends:
Ed. note: This report initially included a graph depicting the Mass attendance of an incomplete portion of self-identified Catholics, reflecting higher rates of self-reported Mass attendance. We replaced that graph with the current one, which includes our entire oversample of Catholic respondents.

